When you are trading Forex, it is important that you understand the different types of charts and how to read them. Each type of chart offers a unique perspective on price movement, and if you understand how to use them correctly, you can make more informed trading decisions. In this article, we will discuss the four most common types of Forex charts and explain how to use them effectively.
What is a Forex chart?
A Forex chart is simply a graphical representation of price movements over time. Typically, these charts will show price movement for a specific currency pair, but they can also be used to track other financial instruments such as stocks, indices, and commodities. Charts are an essential tool for technical analysis and can be used to identify trends, support and resistance levels, and potential trade entry and exit points.
There are four main types of Forex charts: line charts, bar charts, candlestick charts, and point-and-figure charts. Let's take a closer look at each one.
Line Charts
A line chart is the simplest type of Forex chart. It consists of a line that connects the closing prices for a currency pair over a specific period. This type of chart is useful for identifying overall trends, but it does not provide much in the way of detailed information.
Bar Charts
A bar chart is slightly more complex than a line chart, but it provides more information. In addition to the closing price, bar charts also show the opening price, high price, and low price for each period. This type of chart is useful for seeing not only overall trends but also intra-day volatility.
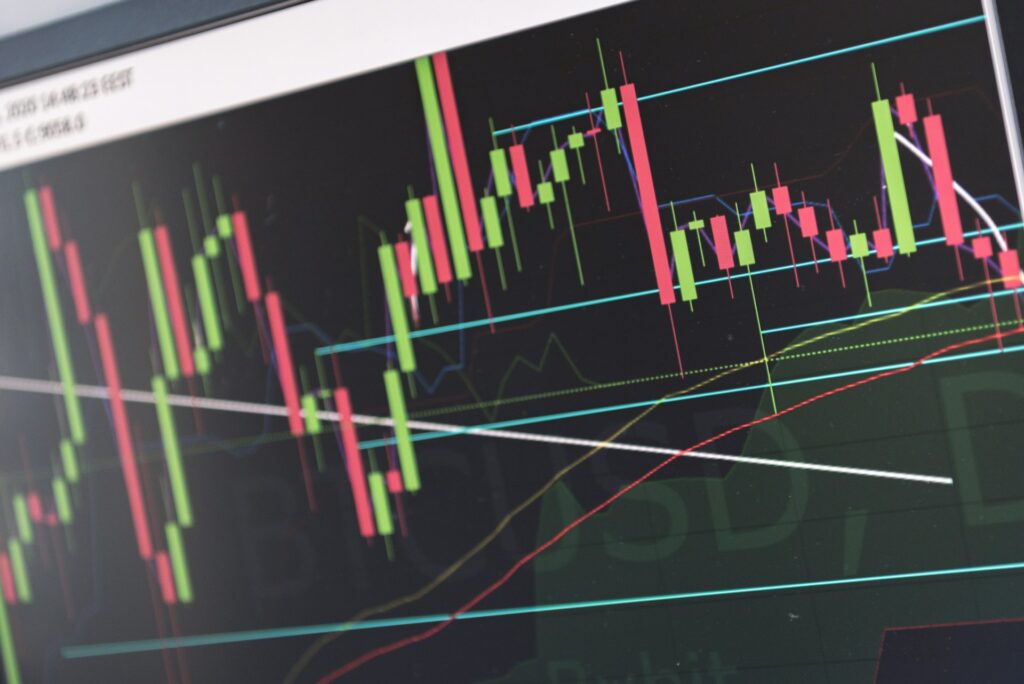
Candlestick Charts
Candlestick charts are similar to bar charts in that they show the same four pieces of data (open, close, high, and low price). However, candlestick charts are typically easier to interpret because they use colors to indicate whether the period closed is higher or lower than the open. Candlesticks that close higher than the open are typically colored green or white, while those that close lower than the open are colored red or black.
Point-and-Figure Charts
Point-and-figure charts are a bit more complex than other types of Forex charts, but they can be very useful for identifying support and resistance levels. This type of chart only shows price movements when there is a significant price change (typically + or - one pip). As a result, point-and-figure charts do not show trends as clearly as other types of charts, but they can be useful for identifying potential trade entry and exit points.